
Dashboard
Access a performance dashboard built for mid-tier engineering and construction leaders who need clear visibility on margins, growth, and financial positioning before decisions are made, not after results appear.
about your dashboard
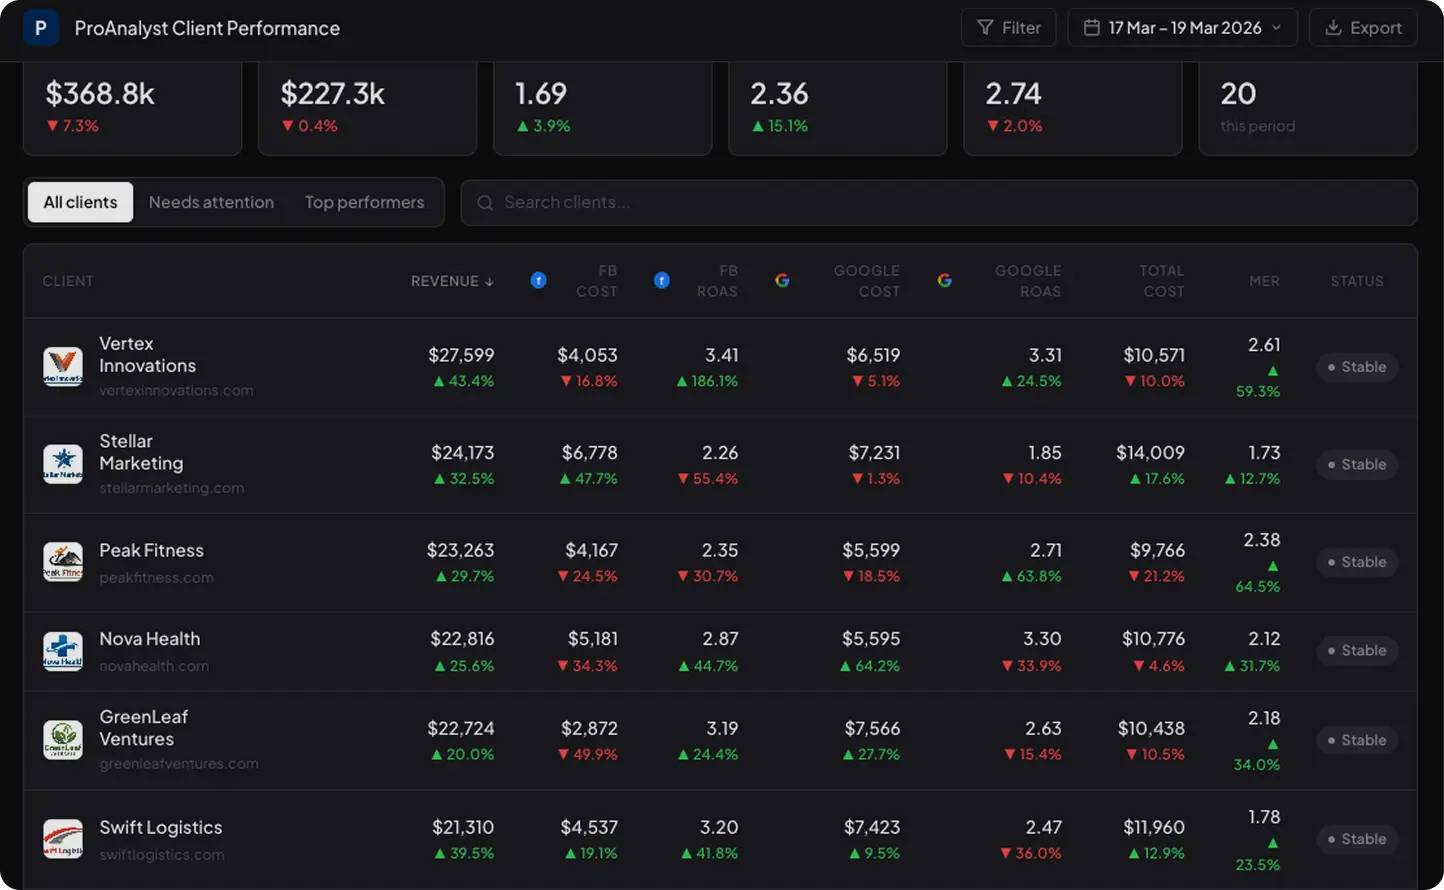
Figure 1 – Dashboard Example
Most mid-tier businesses in this sector don’t have real-time visibility into what’s driving margin performance. Cost pressures, delivery inefficiencies, and growth constraints often become visible too late in quarterly reporting.
This dashboard gives you structured access to the financial signals that matter, designed to help leaders identify performance gaps earlier, understand where value is being created or lost, and make decisions with clearer financial context.
request access
about shivendra

Managing Director & Principal Consultant
Shivendra works with mid-tier engineering and construction businesses to improve EBITDA performance, strengthen capital readiness, and support structured growth.
His background includes a PhD in Engineering, leadership roles at Siemens and Downer Group, and advisory work with CEOs, managing directors, and boards across Australia.
His work focuses on the operational and financial drivers that determine whether
mid-tier firms scale efficiently or stall under complexity.
This dashboard extends that advisory work, giving leaders direct access to financial visibility that supports faster, more informed performance decisions.
EXPECTATIONS
Once inside, you’ll have access to structured financial and performance data designed specifically
for mid-tier engineering and construction businesses. This includes visibility across:
Margin performance
and underlying cost
pressure points
EBITDA trends and how performance is shifting
over time
Revenue growth versus
delivery efficiency
Key indicators used to
assess capital readiness
and scalability
For many businesses, these signals are only fully understood after reporting cycles close.
This dashboard is designed to make them visible earlier and more consistently.
It is an ongoing reference point for decision-making, not a static report.